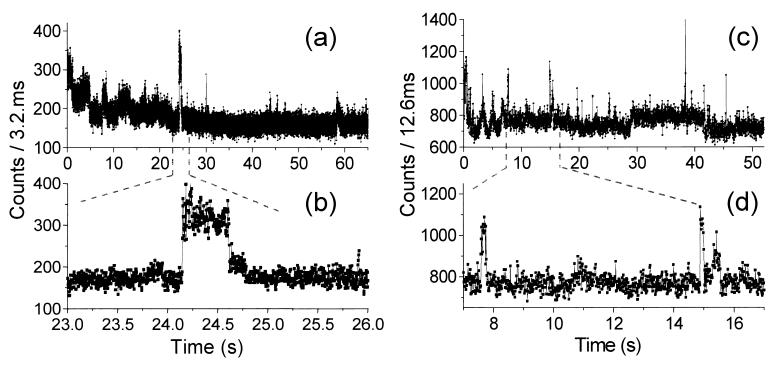
Figure 3.
Real-time fluorescence trajectories of two different S65T molecules. (a and c) Total fluorescence time trace, showing mainly background signal with occasional GFP fluorescence bursts. (b and d) Magnification of the fluorescence bursts, with ≈2 × 10⁴ counts in a 0.5-s burst (b), and ≈5 × 10³ counts in a 0.2-s burst (d).

