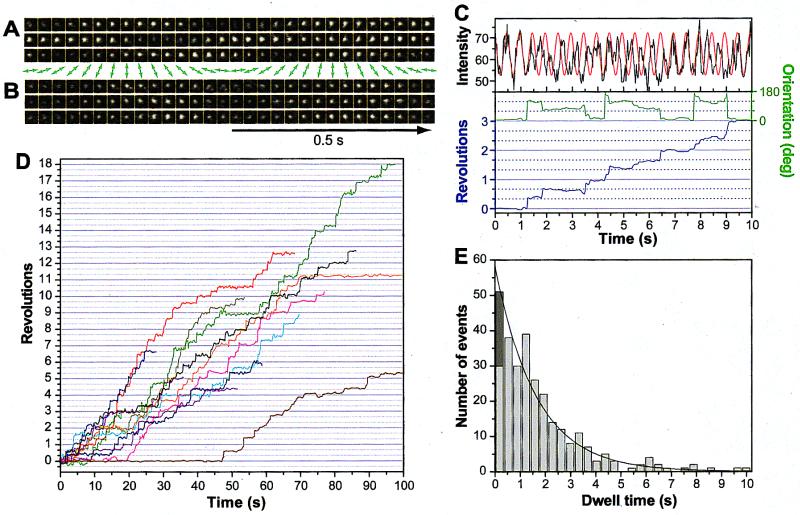
Figure 1.
(A and B) Sequential fluorescence images, at 33-ms intervals, of single Cy3-F1 molecules at 20 nM ATP. The direction of excitation polarization is shown in green arrows. Each image was averaged spatially over 3 × 3 pixels (0.30 × 0.30 μm2); the size of images shown is 17 × 17 pixels. The excitation intensity was 1.1 mW over a sample area of 24 μm in diameter. (C) Time courses of the fluorescence intensity and calculated fluorophore angles. The black line shows the intensity at time t, I(t), of the spot in A integrated over a square of 0.79 × 0.79 μm2 enclosing the spot. When a fluorophore lies at an angle θ in the sample plane, its intensity is expected to flicker as cos2[360°⋅(t/T) − θ] ∝ cos[360°⋅(2t/T) − 2θ], where T (1 s) is the period of excitation rotation. Thus, θ(t) was determined by fitting the observed I(t) with this function over the period between t and t + T/2. The green curve shows θ(t) − θ0, where θ0 = θ(0); values between 0°and 180° were chosen. If this fluorophore had remained at θ0, I(t) would have flickered as in the red line which is proportional to cos2[360°⋅(t/T) − θ0] ∝ cos[360°⋅(2t/T) − 2θ0]. The accumulated rotation angle (blue line) was obtained by assuming that all steps were counterclockwise. (D) Time courses of the stepwise rotation of the γ-subunit at 20 nM ATP. Different lines show different fluorophores (F1). (E) Distribution of dwell times between steps. Each negative 120° step in the orientation records was interpreted as a zero dwell between two consecutive counterclockwise steps and counted as one in the dark part. The solid line shows the exponential fit. The average dwell time was 2.0 s.

