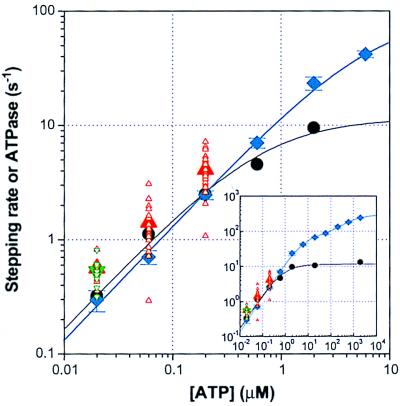
Figure 4.
Comparison of stepping and ATP hydrolysis rates. Stepping rate (3× rotation rate) was determined for each spot as 1/<t> or 3/<3t>, where <t> and <3t> are average times per step (i, green triangles) or turn (ii, red triangles), respectively. Larger symbols show averages over spots. Black circles show previous estimates with actin (20). Hydrolysis rate V (blue diamonds with error bars showing SD) was estimated in solution (i.e., the rate shown is the ensemble average over all molecules in the solution) and was fitted with V = (kcataKmb[ATP] + kcatb[ATP]2)/([ATP]2 + Kmb[ATP] + KmaKmb), where kcata = 83 s−1, kcatb = 292 s−1, Kma = 6.3 μM, and Kmb = 680 μM. Hydrolysis rate of Cy3-labeled F1 (not shown) agreed within experimental error.

