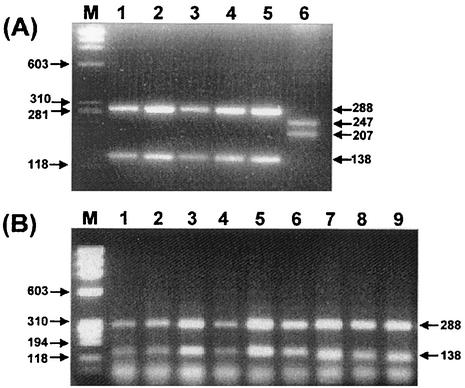
FIG. 3.
Identification of H. pylori culture isolates (A) and H. pylori in the gastric biopsy specimens (B) by PRA using Tru9I. PCR products were digested and electrophoresed on a 1.2% agarose gel. All strains showed two major bands (288 and 138 bp), which are specific for H. pylori. Lane M in both panels, DNA marker φ X174 RF DNA/HaeIII digest. (A) Lanes 1 to 5, H. pylori culture isolates; lane 6, H. mustelae. (B) Lanes 1 to 9, gastric biopsy specimens.

