
Figure 3.
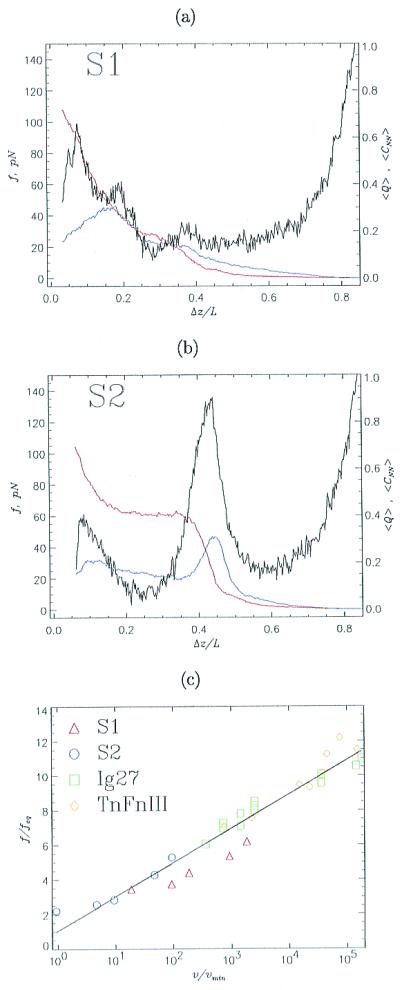
Unfolding kinetics at constant pulling speeds. Black curves (a for S1 and b for S2) show force-extension profiles at the pulling speed v = 6 × 104 μm/s. The horizontal axis gives the normalized distance Δz/L between the fixed sequence terminal and the retaining point (10). The initial separation Δz/L is the equilibrium end-to-end distance at f = 0. Fractions of nonnative contacts <CNN> and <Q> are given in blue and red, respectively. Data are obtained by averaging 100 trajectories. Because the force-induced unfolding of S1 is two-state, the force-extension profile has a single peak, whereas pulling S2, which has an intermediate I, produces two force peaks. (c) The threshold unfolding forces vs. pulling speeds are plotted for S1 (red triangles), S2 (transition I → S, blue circles), titin Ig27 domain (green squares), and tenascin module TnFnIII (yellow diamonds). Forces are normalized by feq either obtained from phase diagrams (Fig. 1) or calculated by using experimental data (1, 5). The pulling speed is expressed in units of the unfolding speed in the absence of force vmin, which is known from simulations or experimental data. The values of vmin are 1.4 × 10⁻⁵ μm/s and 1.3 × 10⁻⁵ μm/s for Ig27 and TnFnIII, respectively. The straight line is the linear fit to the data.