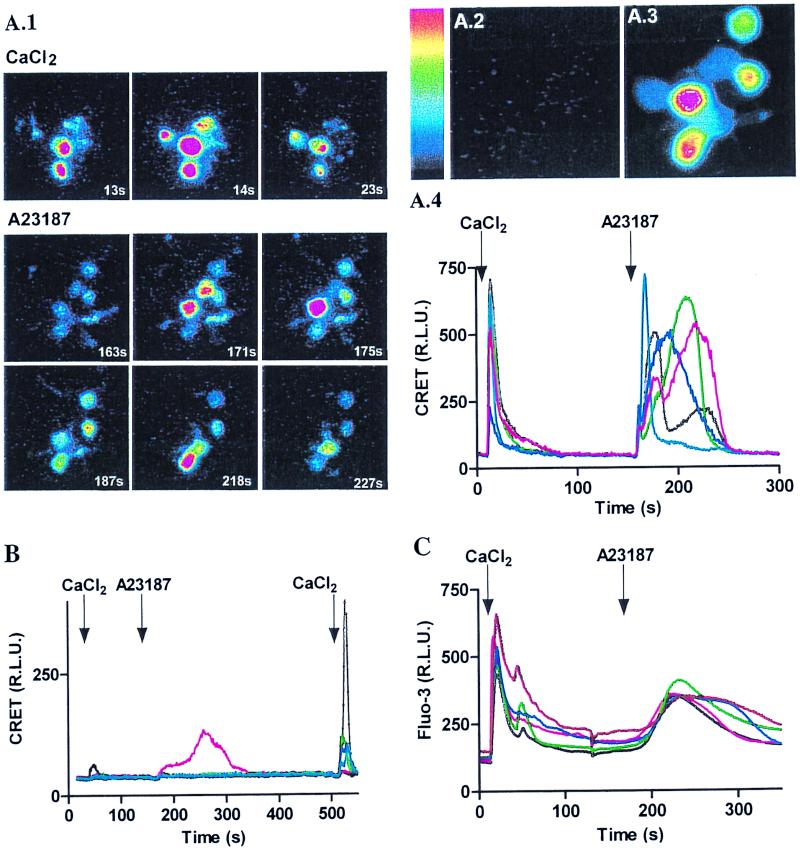
Figure 4.
Ca2+-induced bioluminescence was detected at the single-cell level. Neuro2A cells transfected with pGA (A.1–A.4) or pSG5A (B) were preincubated with 5 μM coelenterazine in a Ca2+-free buffer (A.3). GFP fluorescence made it possible to choose transfected cells. The background recorded before CaCl2 addition (A.2) corresponds to the RLU level at time 0 of the experiment (A.4 and B). Intensities of fluorescence and bioluminescence activity are translated in scaled pseudocolors. Representative pictures of the chosen field are shown after addition of 5 mM CaCl2 and 5 μM A23187 at 13 sec and 159 sec, respectively, after the beginning of the acquisition (A.1 and A.4). Each profile indicates the intensity of light emitted by a single cell. We defined five regions of interest by encircling individual cell soma. With pGA (data not shown) or pSG5A (B) transfection, a high concentration of CaCl2 (100 mM) was added at the end of the experiment (500 sec) to determine whether the bioluminescent protein was still active (C). Control experiments were made with Fluo-3 AM on mock-transfected Neuro2A cells.

