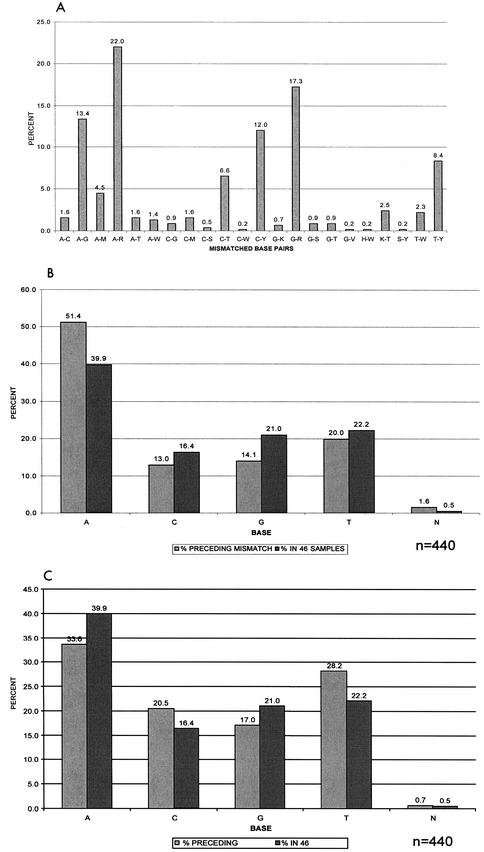
FIG. 3.
Relative frequency of sequence base mismatches and distribution of flanking nucleotides in 46 cross-sectional samples. (A) Distribution of complete and partial base pair mismatches expressed as percentages of the total mismatches within the cohort (n = 440). Nucleotide base pair mismatches A-G, A-R, and G-R showed significantly higher prevalences in the 46 samples than other mismatches (P < 0.001). (B) Relative proportion of bases immediately preceding the mismatches in the 5′ direction compared to the overall proportion of these bases within the cohort. N, ambiguous nucleotides. P < 0.001 for A; P = 0.05 for C; P < 0.001 for G; P = 0.27 for T. (C) Proportion of bases preceding the mismatches in the 3′ direction compared to the overall proportion of these bases within the cohort. P = 0.01 for A; P = 0.02 for C; P = 0.04 for G; P = 0.002 for T.

