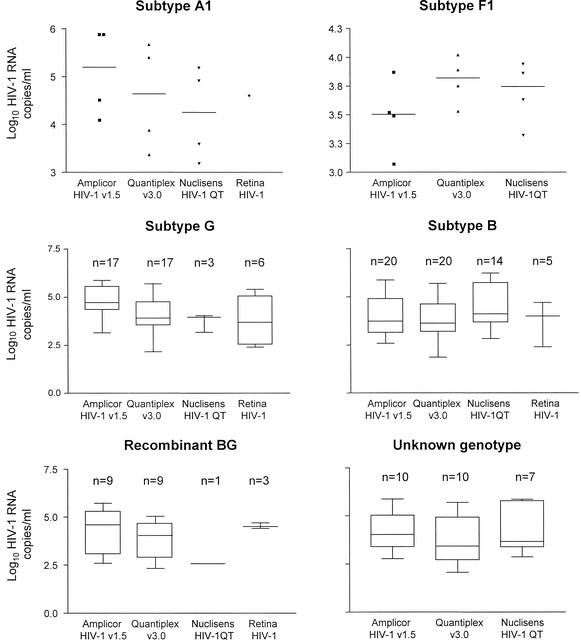
FIG. 2.
HIV-1 RNA levels (log10 copies/ml) for subtypes A1, B, G, F1, and BG recombinant forms. The box extends from the 25th percentile to the 75th percentile, with a line at the median (50th percentile). The tabs extend above and below the boxes to show the highest and lowest values. Only data for samples that were positive were included in the figure. Due to the low number of cases, individual data points are shown for subtypes A1 and F1. V, version. Subtype B graphic includes B/B, −/B, and B/− samples. Recombinant B/G and G/B samples are included in the recombinant BG graphic.

