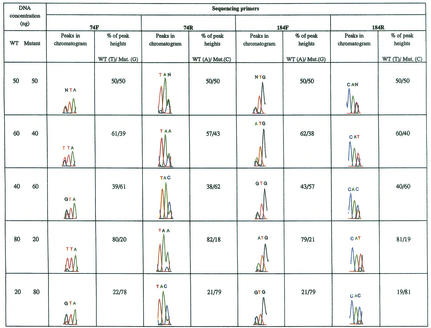
FIG. 2.
Quantitation of DNA concentrations in relation to peak heights. Sequencing reactions were performed with mixtures of purified PCR fragments of WT DNA and the DNA containing the L74V and M184V mutations. To analyze nucleotide peaks at RT codon 74, both coding and noncoding DNA strands were sequenced with the forward and reverse primers 74F and 74R, respectively. The peak heights of nucleotides T and G (TTA/GTA) obtained with primer 74F and nucleotides A and C with primer 74R were measured, and the percentage of each nucleotide in the mixture was calculated. Similarly, peak heights of A and G with primer 184F and T and C with primer 184R were determined at RT codon 184. N, equivalent mixture of two nucleotides resulting in equal peak heights (preset values in software of ABI 377). This chromatogram is representative of at least three independent sequencing reactions. The average values for three sequencing runs are presented in Table 2.

