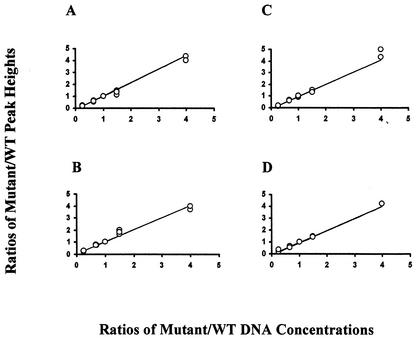
FIG. 3.
Demonstration of a linear relation between DNA concentration and peak heights. Peak-height ratios (mutant/wild type) were plotted versus the corresponding DNA concentration ratios for the four sequencing primers: 74F (A), 74R (B), 184F (C), and 184R (D). Each plot shows 15 datum points (ratios of peak heights) obtained from three independent sequencing runs. A linear regression analysis was performed for each of the three independent runs (see Results). The combined linear regression correlation coefficients (R2) for primers 74F, 74R, 184F, and 184R were 0.994, 0.997, 0.976, and 0.998, respectively.

