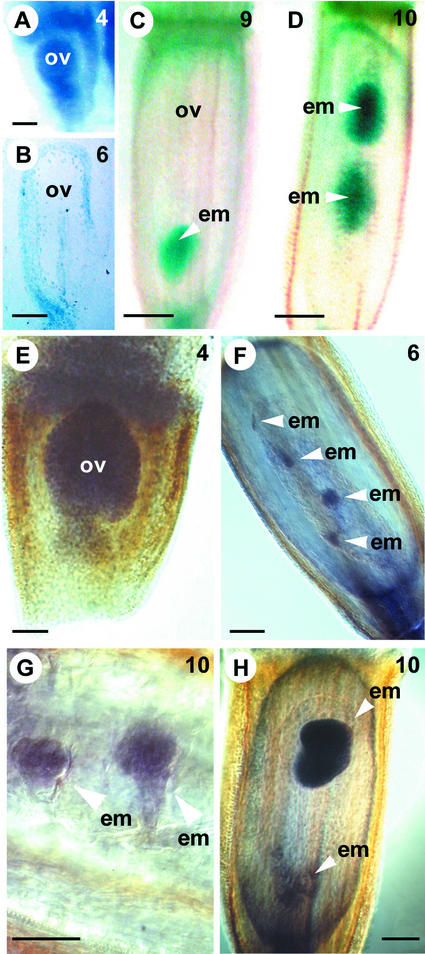
Figure 4.
AtSERK1:GUS and HpSERK-L mRNA Expression during Seed Development in Hieracium.
(A) to (D) show cleared GUS-stained Hieracium ovaries viewed whole-mount or after sectioning (B) using DIC microscopy, and (E) to (H) show WISH samples viewed whole-mount or after sectioning (G) using Nomarski DIC microscopy. The numbers at top right indicate the ovary stage (Koltunow et al., 1998). Bars = 50 μm in (A), (B), (E), (F), and (H), 100 μm in (C) and (D), and 25 μm in (G).
(A) Early ovule (ov) from sexual P4.
(B) Thin section (2 μm) of a GUS-stained mature ovule from apomictic D3.
(C) Fertilized P4 seed containing a globular embryo (em).
(D) Seed from D3 containing two globular-to-heart stage embryos.
(E) Early ovule from apomictic D2.
(F) Anthesis ovule from apomictic D2 containing four small embryo structures, hybridized with antisense DcSERK probe.
(G) Early globular embryos in a D2 seed hybridized with antisense DcSERK probe.
(H) Seed from apomictic D2 containing a chalazal misshapen globular embryo and a micropylar heart-stage embryo hybridized with antisense DcSERK probe.

