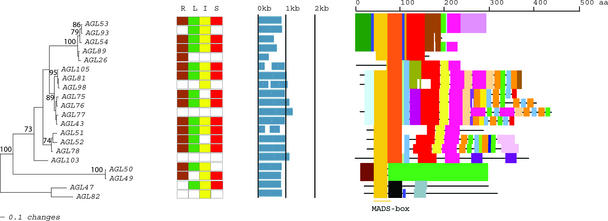
Figure 3.
An Analytical View of the Mβ Group of the Arabidopsis MADS-Box Gene Family.
The following parts are shown from left to right. Protein maximum likelihood tree: The tree was constructed as described in Figure 2. Expression pattern: The gene expression has been determined by RT-PCR using pairs of gene-specific primers. A positive signal is indicated by a colored box for the following tissues: brown for roots (R), green for rosette leaves (L), yellow for inflorescences (I), and red for siliques (S). The white box indicates that no expression could be detected. Gene structure: The gene structure is presented by blue exon(s) and spaces between the blue boxes correspond to introns. The sizes of exons and introns can be estimated using the vertical lines. Protein structure: Each colored box represents a new motif. A white box present in an otherwise continuing sequence of colored boxes means a deletion of an amino acid sequence at the specific position. Black bars represent an amino acid sequence not showing any significant homology to other amino acid sequences within the group of proteins. The length of the motif can be estimated using the scale at top. aa, amino acids.

