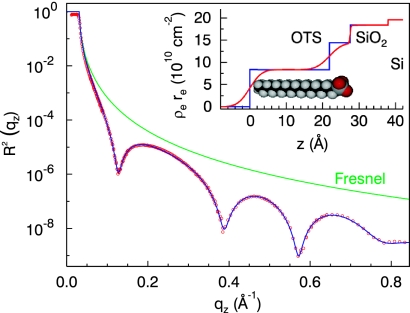
Fig. 2.
X-ray reflectivity of the dry OTS layer grown on a native SiO2 layer on top of a silicon wafer substrate. For comparison the Fresnel reflectivity of a pure silicon substrate is shown (green line). The reflectivity is perfectly reproduced by a two layer model for the OTS self-assembled monolayers for the head and the tail group of the OTS molecule (blue line). (Inset) Electron density profile deduced from the measured reflectivity curve (blue line, box model for the electron density; red line, real density profile including roughness of the layers).

