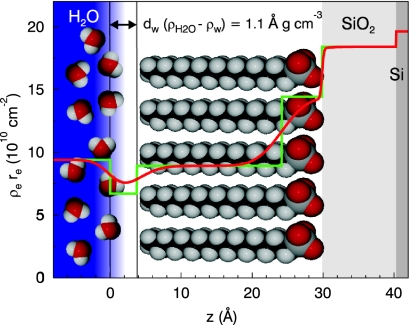
Fig. 4.
The reflectivity is reproduced by a four layer model including SiO2, an OTS layer (head and tail group of the OTS molecule), and a depletion layer between the OTS layer and the bulk water (green line). The underlying electron density profile corresponds to the red reflectivity curve in Fig. 3 (green line, box model for the electron density; red line, real density profile including the roughness of the layers).

