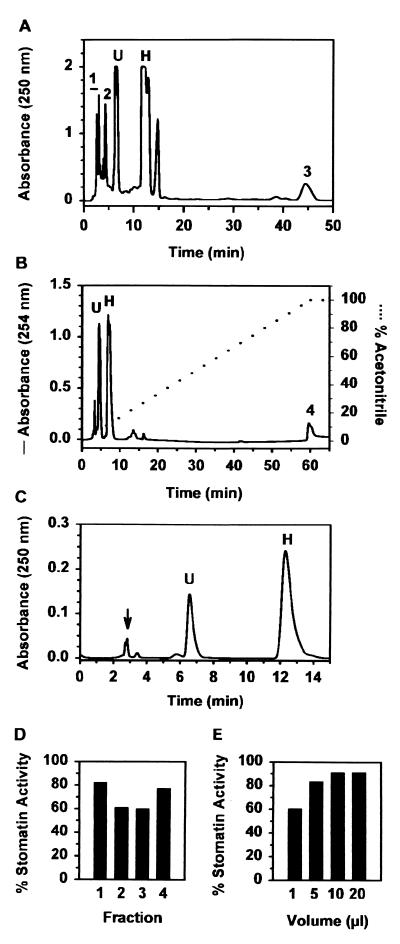
Figure 2.
HPLC elution profiles and activity of stomatin and stomatin fractions obtained by reversed-phase HPLC. (A) Elution profile of stomatin using H2O as the mobile phase at a flow rate of 1 ml/min. A total of 0.6 mg of stomatin (10 μl total volume, 0.138 A250 units/μl) was injected. U and H indicate eluting positions of the uracil and hypoxanthine standards, respectively. Equivalent results were obtained with ammonium dihydrogen phosphate as the mobile phase. (B) Elution profile of stomatin (straight line) using an acetonitrile gradient (dotted line) as the mobile phase at a flow rate of 1 ml/min. A total of 0.6 mg of stomatin (10 μl total volume, 0.118 A254 units/μl) was injected. (C) HPLC elution profile of the major spot from fraction 1 in A eluted from a TLC plate (Fig. 3, arrow). The injection volume was 10 μl (0.183 A250 units/μl). The mobile phase was H2O at a flow rate of 1 ml/min. Peaks identified as uracil and hypoxanthine by NMR are labeled U and H, respectively. The initial fraction (arrow) consisting of one major plus several small peaks did not generate a NMR signal. (D) Maximum activity of fractions 1–3 in A and fraction 4 in B expressed as a percentage of the activity of stomatin. Fraction 1, 5 μl, 0.363 A250 units/μl; fraction 2, 5 μl, 0.112 A250 units/μl; fraction 3, 10 μl, 0.097 A250 units/μl; fraction 4, 10 μl, 0.042 A250 units/μl. Controls contained only H2O or acetonitrile prepared concurrently with fraction 4. (E) Activity of different volumes of the initial fraction in B (0.183 A250 units/μl) expressed as % of the stomatin activity obtained using the same test population.

