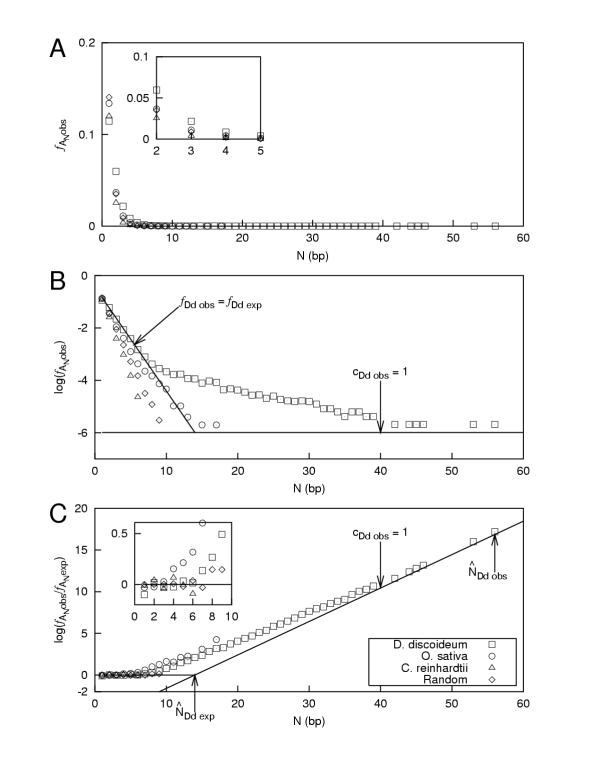
Figure 1.
Frequency plots (one per panel) for equivalent organism sequence data across a range of GC compositions: Dictyostelium discoideum (0.97 Mb at 26.% GC), Oryza sativa japonica (1.5 Mb at 45.% GC) and Chlamydomonas reinhardtii (0.35 Mb at 62.% GC), including a sequence produced by a random number generator with equal weights between bases (1.0 Mb at 50.% GC). The sequences are concatenated from GenBank document "source" sequences and analyzed by Poly as described in the text. These data are presented solely to illustrate the methods described here and not to describe new research.

