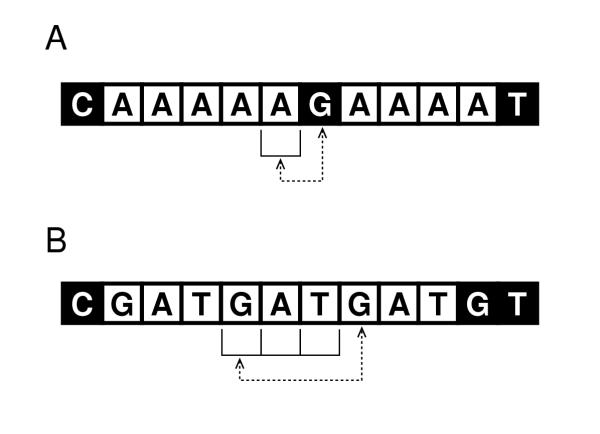
Figure 2.
Operation of the Poly algorithm on DNA sequences. Panel A illustrates the process for a window size of n = 1. Panel B illustrates the process for n = 3. The dotted lines show which bases are compared. White boxes represent bases which are part of an SSR tract, and black boxes represent those which are not.

