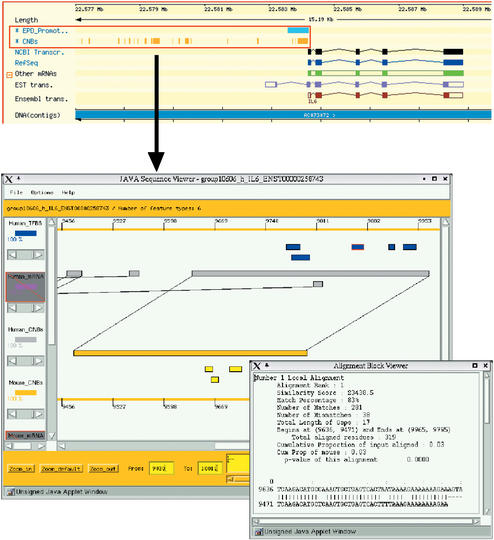
Figure 1.
Schematic depiction of linking DAS tracks and comparative display in CORG. The upper half of the figure shows a cutout from the ENSEMBL ContigView that is centered on the upstream region of the human IL6 gene. Two DAS tracks showing positions of human EPD promoters and CORG conserved non-coding blocks are highlighted in this context. The user can easily jump to the comparative display that is shown in the lower half of the figure by clicking on any CNB feature. The left bar of the applet window is the legend or key to what is displayed in the window center. Human CNBs are shown in light gray, whereas mouse CNBs are displayed in orange. Putative transcription factor binding sites appear either in blue (human genome) or yellow (mouse genome). Each individual track can be activated or deactivated by clicking on the corresponding legend symbol. Each legend symbol has a lever assigned to it. This lever can be used to adjust the proportion of sequence features displayed for a particular track. Less important sequence features (e.g. low-scoring alignments, low-quality binding sites) will start to disappear first as the lever is moved to lower percentage values. The area below the central display lets you control the zoom level of the display and the exact clipping down to the nucleotide level. Floating menus (not shown) providing links to additional information appear as the mouse is clicked over any feature. Selecting the option ‘Alignment view’ from a floating menu opened the little window on the right. In this window, information on different alignment properties like number, ranking according to score, overall proportion of matches and so on is displayed.

