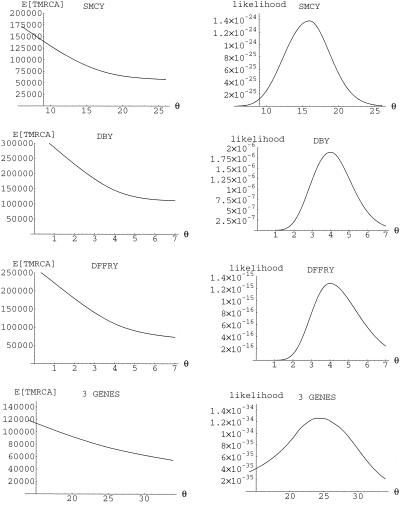
Figure 2.
The likelihood curve and expected age of the MRCA in units of N generations, given θ under the model of constant population size. A number of points (nine for the three genes combined) were obtained by using genetree, and an error function (cubic spline) was fitted between the points for the likelihood curve (expected age of the MRCA).

