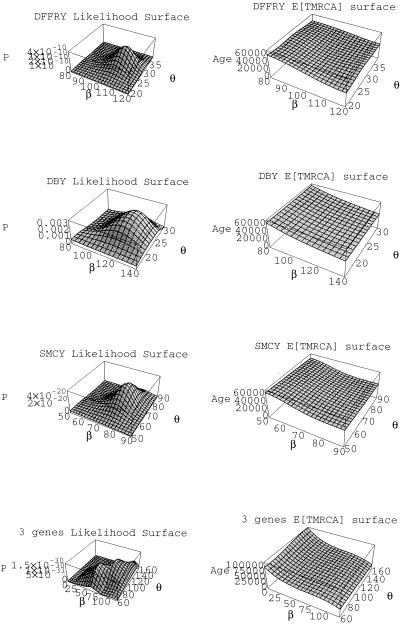
Figure 3.
The likelihood surfaces and E[TMRCA] surfaces in units of N0 generations, given θ and β, under the exponential growth model. The three single gene surfaces used an error function to connect nine points on the likelihood curve. For the three genes combined, an error function was used where possible to connect 37 points. When the error function did not fit, linear interpolation was used. A cubic spline was used for all E[TMRCA] surfaces.

