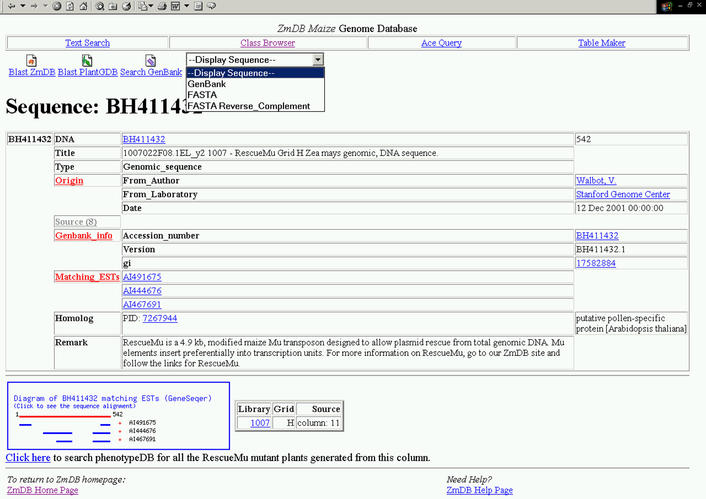
Figure 1.
Display of GSS entries at ZmDB. The screenshot represents a typical display of the GSS records at ZmDB. The central panel provides basic annotation for the sequence, including key GenBank features and links to matching EST records. Source annotation can be viewed when selected. Sequence similarity search tools (BLAST) are linked via the icons on top (selection pastes the sequence into the query screen of the respective tool). The diagram in the lower left panel displays a schematic of the spliced alignment of significantly matching ESTs derived with the GeneSeqer program. The actual alignments and alignment scores can be viewed by clicking on the diagram. Blue lines delineate putative exons. In this example, AI444676 and AI467691 indicate two exons, but EST AI491675 corresponds to an alternative transcript. The small table to the right of the diagram links to the source DNA sample, and the link below facilitates a search of the PhenotypeDB for possible source plants.

