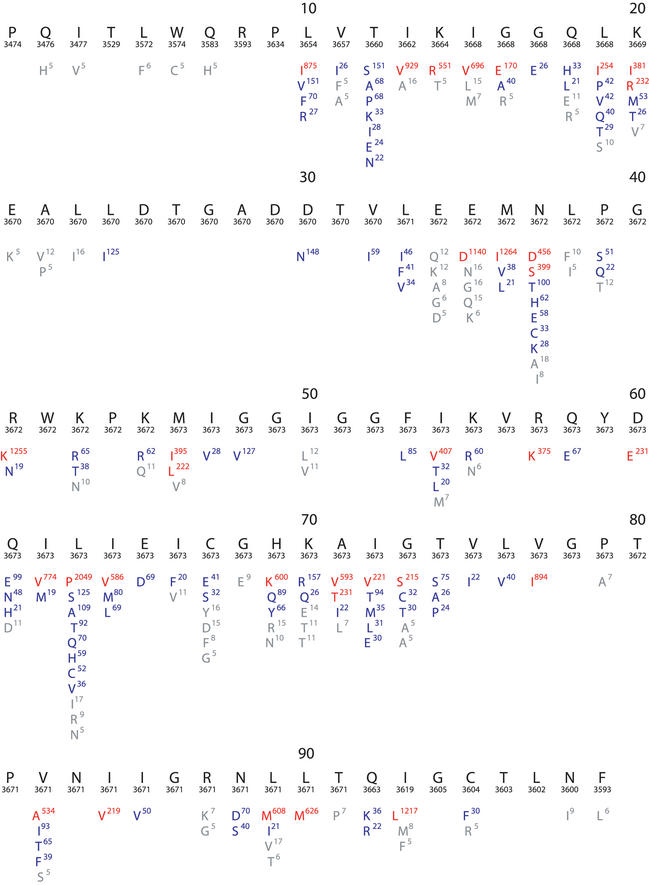
Figure 1.
Composite sequence alignment of HIV-1 protease, positions 1–99. This figure resulted from a query that retrieved all HIV-1 sequences in the database including those belonging to different subtypes and those obtained from treated and untreated individuals. Beneath the numbered consensus sequence is the number of isolates in the database for which sequence information at the position is available. The remaining lines in each row show the frequency of variation at each position in the database. Amino acids shown in red have a mutation rate ≥5%; those in blue have a mutation rate between 1 and 5%; and those in grey of 0.1–1%.

