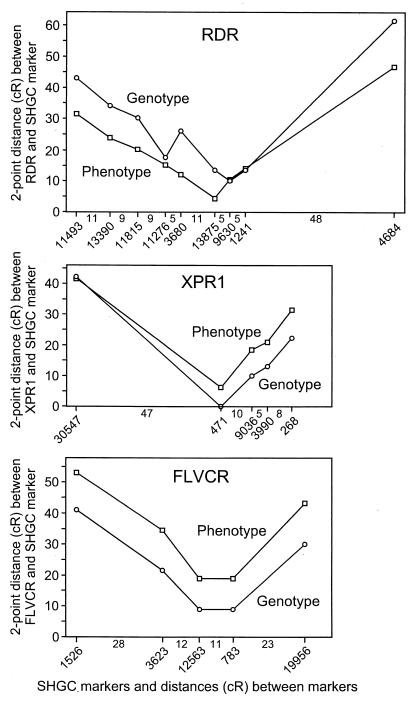
Figure 2.
Two-point distances between retrovirus receptors and ordered markers (x axis) in comparison to SHGC-ordered marker map distance (y axis). The location and identification numbers of the SHGC-ordered markers are shown below the diagrams with the distances (cR) shown between markers. All distances are drawn to the same scale.

