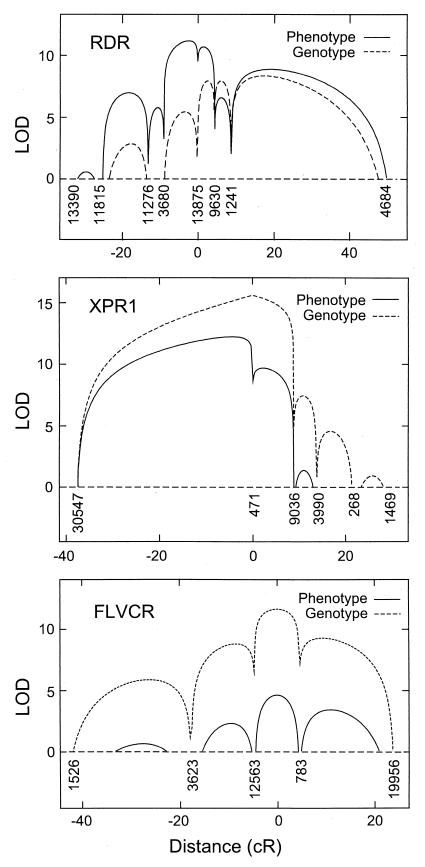
Figure 3.
Multipoint analysis of the likelihood of linkage (lod) between ordered markers and the retrovirus receptors by phenotypic and genotypic analysis. SHGC-ordered marker numbers are shown below the curves. Map distance is plotted on the x axis. lod scores below 0 are not shown. Multipoint lod scores were computed as described (20) with the computer program radmap written by L.K.

