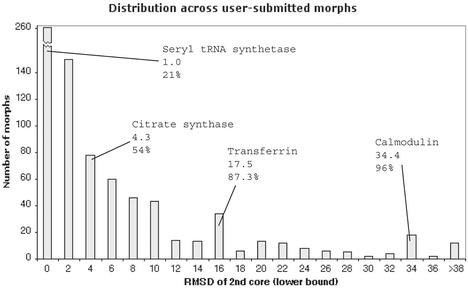
Figure 2.
A representative distribution of a statistic from one subset of the database. The subset encompasses all user-submitted morphs. The statistic used is the RMS deviation (in Angstroms) between start and end frames of the ‘2nd core’, the moving part of the protein, as calculated by our sieve-fitting procedure. The positions of several well-studied motions in this distribution are highlighted and labeled with their respective RMSD and percentile values.

