
Figure 3.
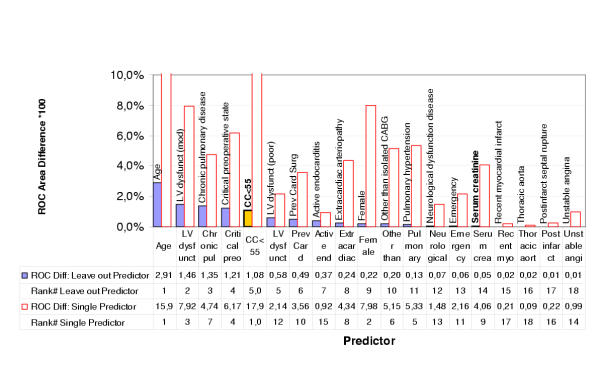
Contribution of single predictors of the EuroSCORE measured by change in area under the Receiver Operating Characteristics (ROC) curve (times 100) in two ways: The "Leave out Predictor" results show the reduction of ROC area from the full set of EuroSCORE variables ROC = 0.776 (model 3 in Table 3). The "Single Predictor" numbers indicate the predictive power of each isolated variable (i.e. ROC gain above 0.5, times 100). Furthermore the binarized creatinine clearance variable ("CC<55") is added (as a replacement for serum creatinine) and its insertion position in the rank ordering 1..18 indicated by an extra decimal digit (5.0 and 1.0 before 5 and 1 resp.). Note, that in the "Leave out" case the CC-variable reaches the 5th most contributing predictor and in the single predictor experiment it even outperforms "Age" and gains the top rank. Serum creatinine holds only position 14 and 9 respectively.