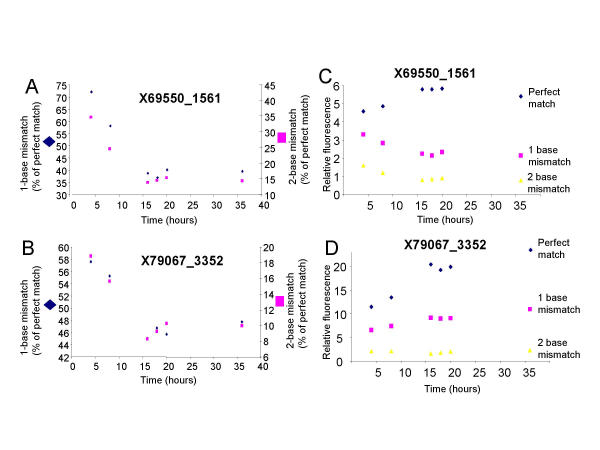
Figure 3.
Specificity against mismatches increases with hybridization time. (A and B) The intensity of a one-base (diamonds, left y-axis) or two-base (squares, right y-axis) mismatch, as a percent of the perfect match signal, is plotted as a function of time for two different probe sequences. (C and D) The intensity of the perfect match (diamonds), one-base mismatch (squares), or two-base mismatch (triangles) are plotted as a function of time for the same probe sequences shown in A and B.

