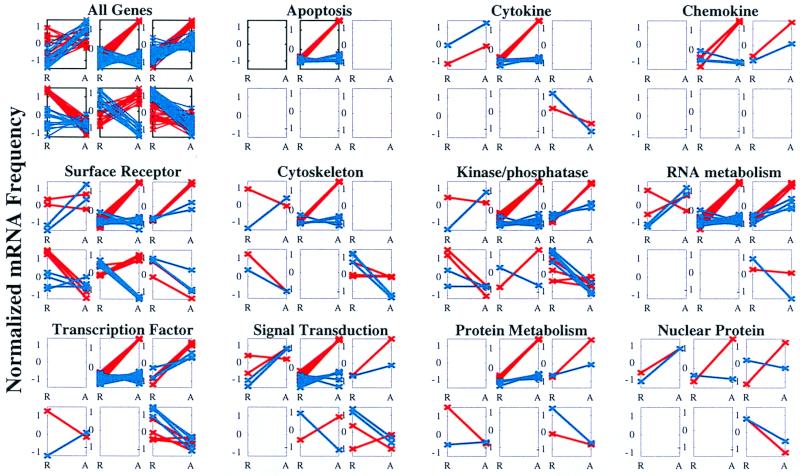
Figure 2.
The fraction of genes in Vα24JαQ T cell clones altered by anti-CD3 treatments. Graphical representation of genes differentially expressed in natural killer T cell clones derived from a diabetic/nondiabetic twin pair. Clones ME10 (blue; IL-4-null) and GW4 (red; IL-4+) were treated with control IgG (designated R for Resting) or anti-CD3 (designated A for Activated) for 4 h, after which RNA was isolated and analyzed on Genechips monitoring the expression of 6,800 human genes from the Unigene collection. Genes whose expression was modulated at least 2-fold in either clone were chosen for clustering analysis with the Self-Organizing Map algorithm (15). This method was used to cluster genes into six distinct groups, based on differential expression patterns between ME10 and GW4, independent of expression magnitude. The first group displays the six patterns represented when all genes meeting the 2-fold change criterion are used. The other groupings reveal the differential expression patterns of selected gene functional classes. Individual genes of each functional class falling into the different clusters are identified in Table 1.

