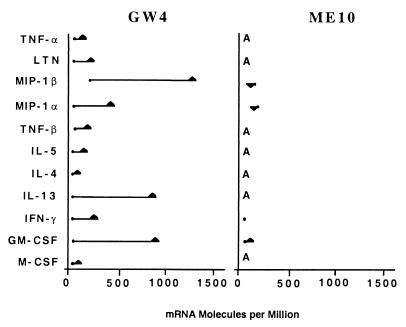
Figure 3.
Changes of expression on genes for cytokines and chemokines. Vα24JαQ T cell clone GW4 (IL-4+) is compared with ME10 (IL-4-null). For each individual transcript, the anti-CD3-induced hybridization intensity is shown. RNA was isolated, amplified, and hybridized to Genechips, displaying probes for 250 genes of immunological interest. This chip is custom designed for quantitative analysis by increasing the number of probes for the detection of each specific transcript. In the graph, the position of the black dot represents hybridization intensity for each gene before anti-CD3 stimulation, and a line is drawn to the position of hybridization intensity after stimulation. Genes that were called significantly different by a gene expression algorithm, and that changed by at least 2-fold, are indicated by a bold line. Upward- or downward-pointing arrowheads indicate increases or decreases in gene expression in the stimulated cells relative to the unstimulated cells. A, the transcript was not detected; TNF, tumor necrosis factor; LTN, lymphotactin; MIP, macrophage inflammatory protein; GM-CSF, granulocyte–macrophage colony-stimulating factor; M-CSF, macrophage colony-stimulating factor.

