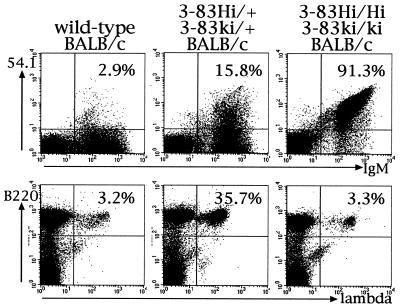
Figure 2.
Flow cytometric analysis of spleen cells. Cells were isolated from wild-type, 3-83Igi hemizygous, and 3-83Igi homozygous mice on a BALB/c background. (Upper) The 54.1 and IgM staining of cells in the lymphocyte gate. Numbers refer to frequency of 3-83Ig+ cells in the total sIgM+ cell population. (Lower) The B220 and λ staining in cells of the lymphocyte gate. Numbers refer to frequency of λ+ cells in the total B220+ cell population.

