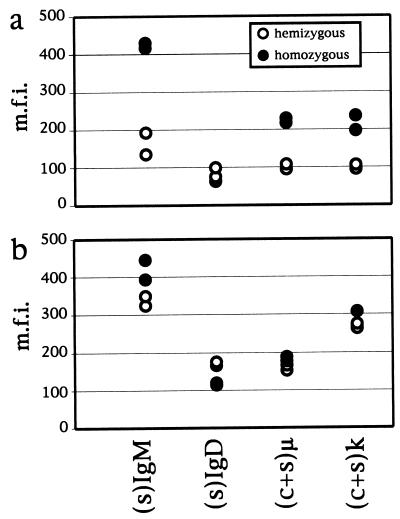
Figure 3.
Analysis of Ig protein levels by flow cytometry. Cells were isolated from either bone marrow (a) or spleen (b) of hemizygous (○) and homozygous (●) 3-83Igi mice of BALB/c genetic background. Cells were stained for B220 and additionally stained for surface (s) IgM (R33-24 antibody), sIgD, total cytoplasmic and surface (c+s) μ (goat anti-mouse IgM antibody) or total (c+s) κ. Staining of total Ig was performed in the presence of saponin. Arithmetic mean florescence intensity (m.f.i.) values for the stainings reported were calculated on, respectively, B220low (immature B) or total B220+ cells in the bone marrow or spleen cells. Each circle corresponds to a mouse.

