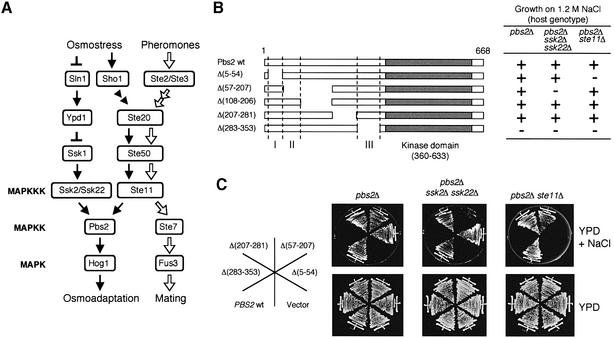
Fig. 1. (A) Schematic diagram of the HOG osmoregulatory and the mating pheromone signal transduction pathways in yeast. For the sake of clarity, a simplified model of the pathways is shown. Although Ste20, Ste50 and Ste11 are shared by the two pathways, an osmostress signal emanating from Sho1 follows the black arrows, whereas a pheromone signal follows the white arrows. Ste11 can also be activated by nitrogen limitation (not shown). The arrows do not necessarily indicate direct interactions. (B) Summary of functional analyses of the Pbs2 N-terminal regulatory region. A series of pbs2 mutants with N-terminal deletions as indicated was constructed using a centromeric vector, YCplac22I′. The mutants were introduced into the osmosensitive strains TM260 (pbs2Δ) TM280 (pbs2Δ ssk2Δ ssk22Δ) or KT503 (pbs2Δ ste11Δ) and their ability to complement osmosensitivity was determined. The Pbs2 coding sequence is represented by the horizontal bars; the kinase catalytic domain is shown as a filled box, and three regulatory subdomains (RSD-I, -II and -III) are represented as I, II and III. Growth (+) or no growth (–) on YPD + 1.2 M NaCl is shown. (C) Complementation of the osmosensitivity of TM260, TM280 or KT503 by pbs2 mutants with various N-terminal deletions. Cells were streaked on YPD or YPD + 1.2 M NaCl plates, and incubated at 30°C.

An official website of the United States government
Here's how you know
Official websites use .gov
A
.gov website belongs to an official
government organization in the United States.
Secure .gov websites use HTTPS
A lock (
) or https:// means you've safely
connected to the .gov website. Share sensitive
information only on official, secure websites.
