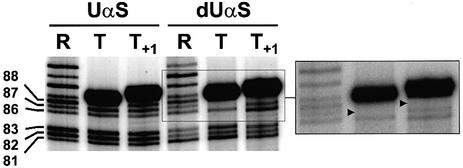
Fig. 5. RNAP contacts to the 3′ tips of transcripts. An enlarged view of a gel showing UαS and dUαS signals at 3′-terminal positions of the T and T+1 transcripts. The dUαS region is also shown with a lower gel exposure. Gel migration has been increased to improve the resolution of the 3′ region (compare with Figure 4). Gel lanes are annotated as in Figure 4. Strong termination-reducing dUαS effects at the transcript 3′ tips are indicated by black triangles.

An official website of the United States government
Here's how you know
Official websites use .gov
A
.gov website belongs to an official
government organization in the United States.
Secure .gov websites use HTTPS
A lock (
) or https:// means you've safely
connected to the .gov website. Share sensitive
information only on official, secure websites.
