
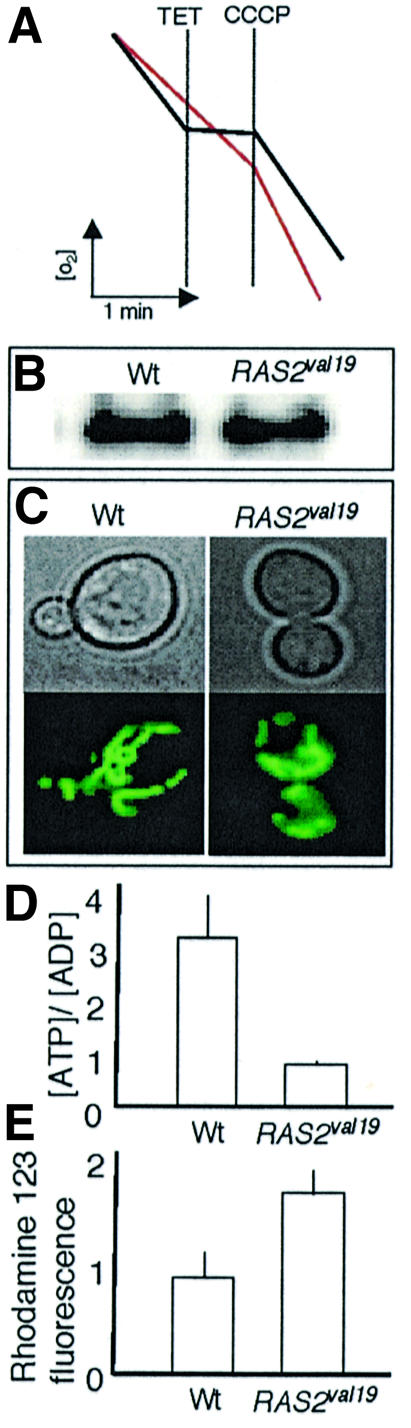
Fig. 3. Respiratory mode, mitochondrial content, membrane potential and energetics of RAS2val19 cells. (A) RSV measurements on wild-type (black line) and RAS2val19 (red line) cells growing exponentially in YPD. Cells were placed in an oxygraph chamber and oxygen consumption was followed on-line. TET and CCCP were then added to the measuring chamber and RSV was calculated as explained (Aguilaniu et al., 2001). (B) Western blot quantification of the levels of the e subunit of ATPase in wild-type and RAS2val19 cells grown exponentially in YPD. (C) Mitochondrial content of exponentially growing wild-type and RAS2val19 cells detected by staining with MitoTrackerGreen FM. (D) [ATP]/[ADP] ratios in exponentially growing wild-type and RAS2val19 cells. (E) Membrane potential of wild-type and RAS2val19 cells measured by Rhodamine 123 fluorescence. The standard deviation is shown on top of the bars.