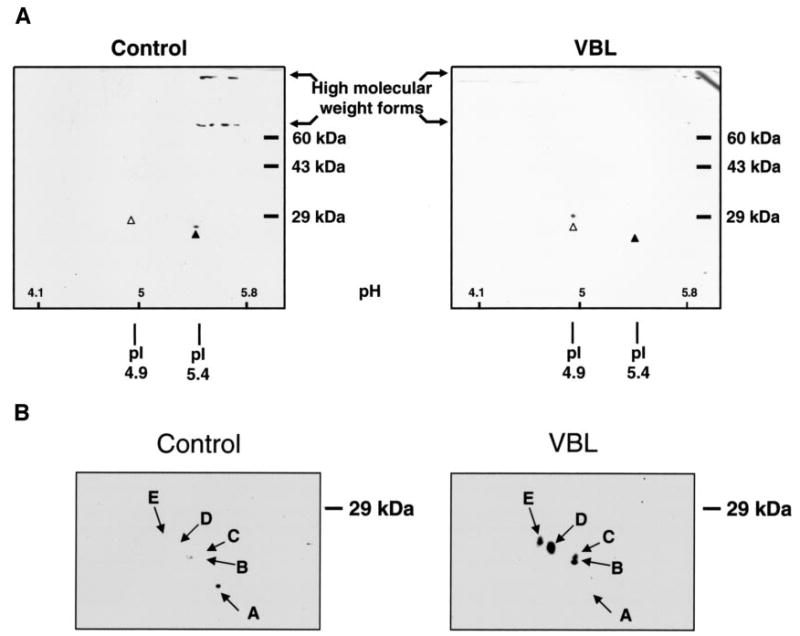
FIGURE 5. Analysis of Bcl-xL and Bcl-2 by two-dimensional gel electrophoresis.

KB-3 cells were either untreated (control) or treated with 30 nM vinblastine for 36 h (VBL), and cell extracts were subjected to two-dimensional PAGE, as described under “Experimental Procedures.” A, immunoblot analysis of Bcl-xL. An acidic range of ampholines was employed, with approximate pH values shown inset at the bottom. The monomeric form of Bcl-xL, observed in control cells (pI of 5.4), is indicated with the black arrowhead, and the phosphorylated form, observed in vinblastine-treated cells (pI of 4.9), is indicated with the white arrowhead. High molecular mass species are also indicated. B, immunoblot analysis of Bcl-2. Only the relevant portion of the gel is shown, because Bcl-2 was strictly monomeric with no evidence of high molecular mass species. The pI values and apparent molecular masses of the resolved species of Bcl-2 are as follows. Spot A, pI 6.8, 23 kDa; spot B, pI 6.6, 24.5 kDa; spot C, pI 6.6, 25.1 kDa; spot D, pI 6.3, 26.9 kDa; spot E, pI 6.0, 27.5 kDa.
