
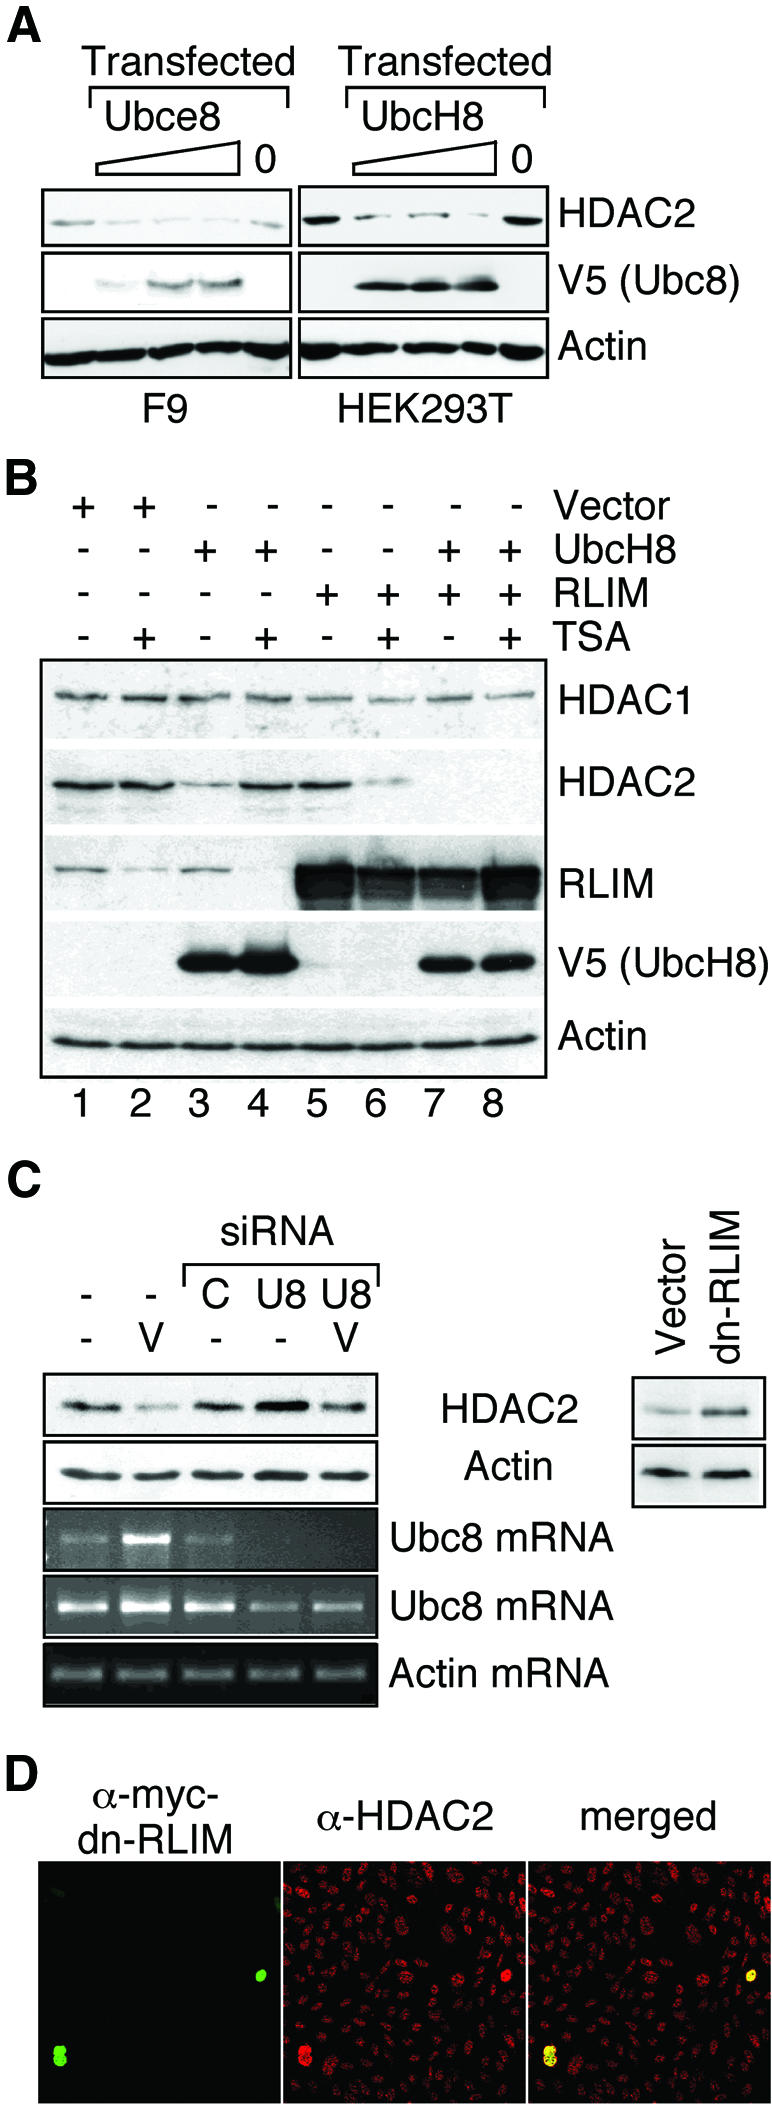
Fig. 6. Identification of HDAC2-ubiquitinating E2 and E3 enzymes as limiting factors for HDAC2 degradation. (A) F9 or HEK293T cells were either left untransfected (left lanes) or transfected with 0.5, 1 or 1.5 µg of Ubce8, UbcH8 or empty expression vector (0). Twenty-four hours after transfection, HDAC2 levels were determined in whole-cell lysates by western blot analysis. The amount of transfected murine Ubce8 or human UbcH8 was analyzed by western blotting against the V5 epitope tag. Similar results were obtained in at least three independent experiments. (B) HEK293T cells were transfected as indicated with expression vectors for UbcH8 or RLIM and empty expression vector. If indicated, cells were treated with 300 nM TSA 24 h after transfection and whole-cell extracts for western blot analysis were prepared an additional 24 h later. One representative of two similar experiments is shown. (C) Endogenous Ubc8 levels were lowered in HEK293T cells (left panel) by transfection of two siRNAs (AACCTCCCTACC ACCTGAAAG and AACTGGAAGCCTTGCACCAAG) directed against the Ubc8 mRNA (U8) or a non-related mRNA (C). HDAC2 levels were determined by western blot analysis in cells without further treatment or after treatment with 1.5 mM VPA (V). Semi-quantitative analysis of Ubc8 mRNA was performed by 30 (upper) or 35 (lower) cycle RT–PCR reactions in comparison to actin (25 cyles). Right panel: HEK293T cells were transfected at high efficiency with an expression vector for a myc-tagged dominant-negative mutant form of RLIM or the empty expression vector. HDAC2 levels were determined 48 h later by western blot analysis. The panels show one representative of at least three independent experiments. Quantitative values for HDAC2 levels were normalized for actin signals. (D) CHO cells were cultured on glass slides and transfected at low efficiency with the myc-tagged dominant-negative mutant form of RLIM. Expression of the transgene (left panel) and endogenous HDAC2 (middle panel) was detected by immunostaining. Representative frames and a merged picture (right panel) are shown.