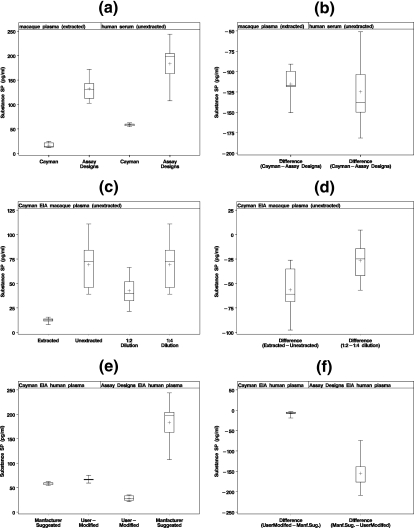
FIG. 1.
(a and b) Parallel evaluation of five extracted rhesus macaque plasma and unextracted human plasma samples for SP using two different SP antigen competition EIA kits. (c and d) Comparison of SP levels in 18 paired extracted and unextracted plasma samples (1:4 dilution prior to analysis) and the influence of sample dilution prior to analysis in rhesus macaque plasma using the Cayman SP EIA. (e and f) Influence of modification of the standard curve on SP values using the Cayman EIA and the Assay Designs EIA in the evaluation of unextracted human plasma at a 1:4 dilution. The upper and lower whiskers of the box-and-whisker plots are the maximum and minimum SP values. The first and third quartiles (25th and 75th percentiles) are represented by the lower and upper edges of the box, respectively. The mean is represented by the plus sign, and the median (50th percentile) is the line inside the box.

