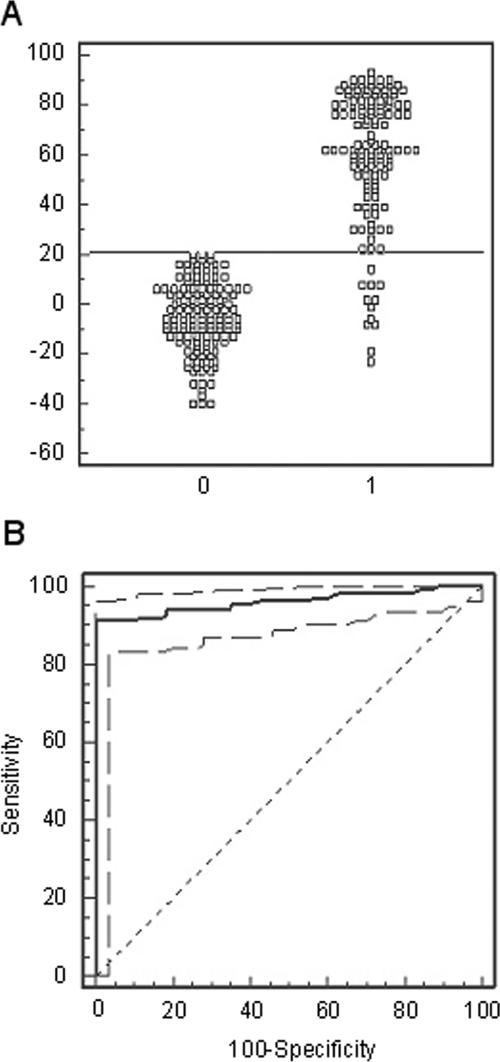
FIG. 2.
(A) Frequency distribution of known-negative (left cluster) and known-positive (right cluster) sera. A sample was considered positive with an inhibition equal to or greater than 21%. (B) ROC plot (solid line) of sensitivity and specificity with 95% confidence levels (broken lines) calculated from the 135 known-positive and 141 known-negative serum samples, establishing 21% inhibition as the optimal cutoff value (the percent inhibition that corresponds to the maximum diagnostic sensitivity and specificity). A random, no-discrimination line is shown as the 45° broken line.

