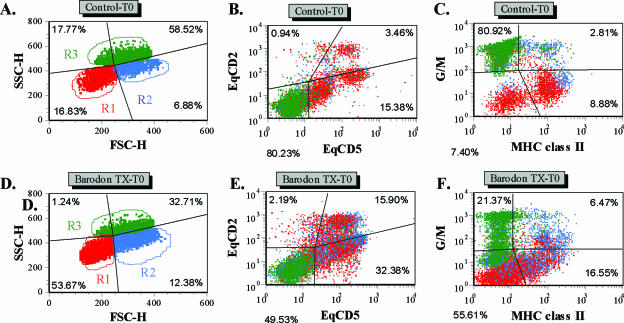
FIG. 2.
Representative dot plot profiles of PBMC from a control horse (A to C) and a BARODON-treated horse (D to F) labeled with two MAbs (Table 1) for equine CD2 (EqCD2) and EqCD5 (B and E) or for granulocytes and monocytes (G/M) and MHC-II (C and F) before (time zero, T0) 3 days of culture in RPMI alone or with PHA. In profiles A and D, the quadrants show the division between small lymphocytes in gate 1 (R1), large lymphocytes and monocytes in gate 2 (R2), and granulocytes in gate 3 (R3), as well as the relative frequencies of cells in each gate at T0. Profiles B and E, with gates placed only on 1, 2, and 3, show the frequency of EqCD2− EqCD5− cells (lower left quadrant), EqCD2+ EqCD5− cells (upper left quadrant), EqCD2+ EqCD5+ cells (upper right quadrant), and EqCD2− EqCD5+ cells (lower right quadrant). Profiles C and F, with gates on 1, 2, and 3, show the frequency of G/M− MHC-II− cells (lower left quadrant), G/M+ MHC-II− cells (upper left quadrant), G/M+ MHC-II+ cells (upper right quadrant), and G/M− MHC class II+ cells (lower right quadrant).

