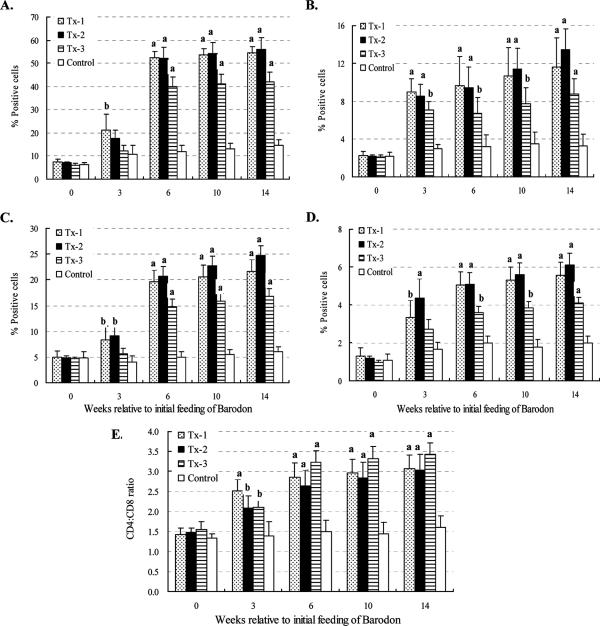
FIG. 5.
Summary of FC analysis of CD4+ (A), CD4+ CD25+ (B), CD8+ (C), and CD8+ CD25+ (D) T lymphocytes and the CD4/CD8 ratio (E) from the proportions of CD4+ and CD8+ T lymphocytes in peripheral blood with gates placed only on 1 and 2 at time zero. Horses in one group were fed Omolene feed as well as Barodon-biogenic feed (Tx-1; n = 6), group two was fed only Omolene feed (Tx-2; n = 6), group three was fed only Barodon-biogenic feed (Tx-3; n = 6), and the untreated control group was fed general feed with no BARODON (Control; n = 6). Significant differences between control animals and animals treated with BARODON are as indicated in the figure (a, P < 0.01; b, 0.01 < P < 0.05). Detailed information on how much BARODON was included in each feed and how subsets were analyzed by selective gating, which was used to show the frequency of each cell population, is provided in Materials and Methods.

