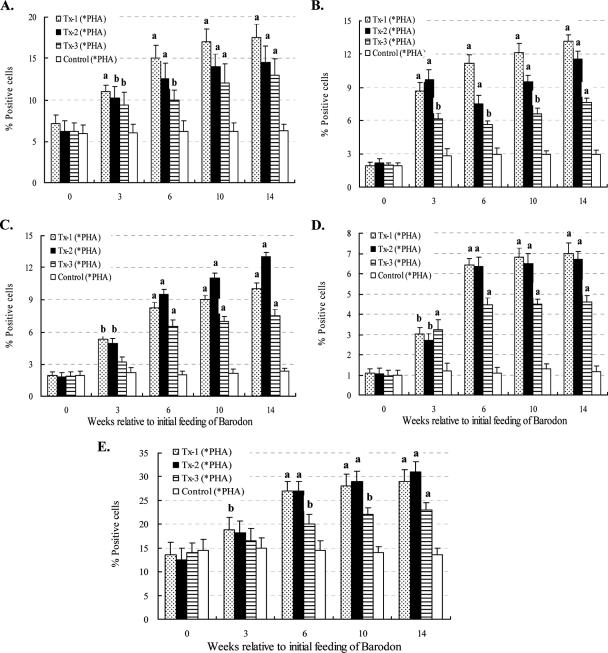
FIG. 6.
Summary of FC analysis of CD4+ (A), CD4+ CD25+ (B), CD8+ (C), and CD8+ CD25+ (D) T lymphocytes in peripheral blood with gates placed only on 1 and 2 and blast, proliferating lymphocytes (E) in peripheral blood with a gate placed only on 2 after 3 days of culture in RPMI alone or with PHA. Horses in one group were fed both Omolene feed and Barodon-biogenic feed (Tx-1; n = 6), while a second group was fed only Omolene feed (Tx-2; n = 6) and a third group was fed only Barodon-biogenic feed (Tx-3; n = 6). The untreated control group was fed general feed with no BARODON (Control; n = 6). Significant differences in the proportions of CD4+ (A), CD4+ CD25+ (B), CD8+ (C), and CD8+ CD25+ (D) T lymphocytes and cells in gate R2 (E) after culture in RPMI alone and with PHA, between control horses and BARODON-treated horses, are as indicated in the figure (*PHA = 3 days of PHA − 3 days of RPMI; a, P < 0.01; b, 0.01 < P < 0.05). See Materials and Methods for detailed information on the analysis of subsets by selective gating, used to show the frequency of each cell population.

