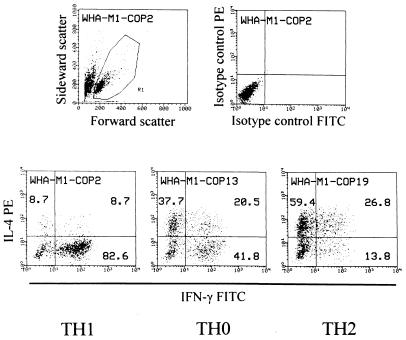
Figure 1.
Cytokine profile of COP-reactive TCL analyzed by intracellular double-fluorescence flow cytometry. (Upper Left) Dot plot of scatter parameters. (Upper Right) Isotype controls of one representative TCL. (Lower) Cytokine profiles of three representative TCL. Dot-plot events in the single-positive and double-positive quadrants were added. They represent “activated” cells. The numbers represent the percentage of events in each quadrant relative to the total number of activated cells. TH1, TH0, and TH2 assignments were made according to the algorithm described in the text.

