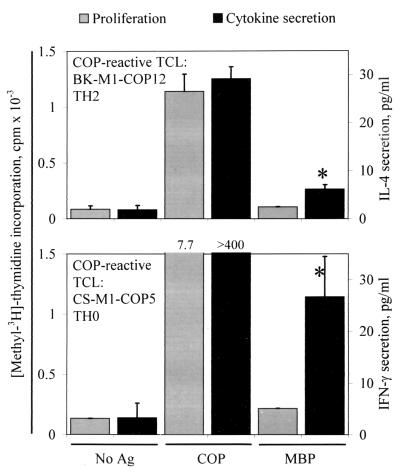
Figure 5.
Proliferative response and cytokine production by two COP-reactive TCL. The left vertical axis denotes proliferation (gray bars), and the right vertical axis denotes cytokine secretion (black bars) measured by ELISA in supernatants of the same assay. Ag, antigen. (Upper) IL-4 secretion by a TH2 COP-reactive TCL. (Lower) IFN-γ secretion by a TH0 COP-reactive TCL. Asterisks denote cytokine levels greater than 2 SD above background. The lower limit of detection (sensitivity) of the cytokine ELISAs is <2 pg/ml IL-4 or IFN-γ.

