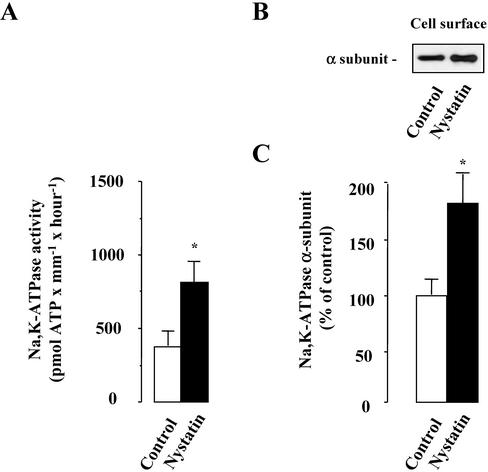
Figure 1.
Effect of high [Na+]i on Na,K-ATPase activity and cell surface expression in isolated rat CCDs. The activity (A) and cell surface expression (B and C) of Na,K-ATPase were analyzed on microdissected CCDs incubated without (control) or with 0.1 U/μl nystatin for 1 h at 37°C. (A) The activity of Na,K-ATPase was determined under Vmax conditions on freeze/thawing permeabilized CCDs. Results are expressed as pmol ATP × mm–1 × h–1 and are means ± SE from five animals. *p < 0.05. (B and C) The Na,K-ATPase α-subunit was detected by Western blotting performed after biotinylation and streptavidin precipitation of cell surface proteins. (B) Representative immunoblot showing Na,K-ATPase cell surface expression. (C) Bars represent densitometric values expressed as the percentage of the optical density value obtained from untreated samples (control). Results are means ± SE from eight animals. *p < 0.05 vs. control values.

