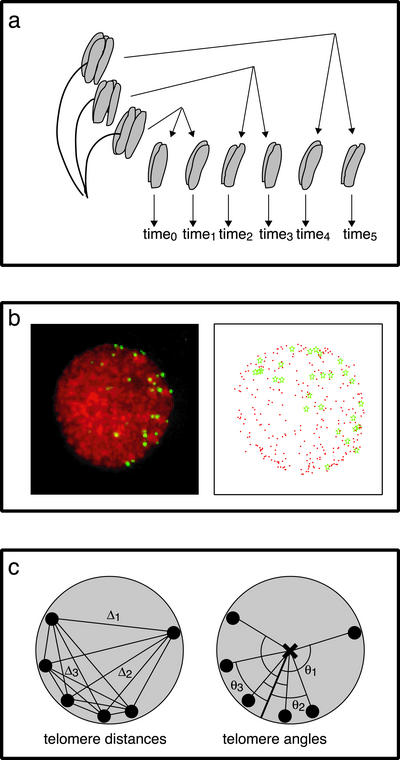
Figure 1.
Methods used in quantitative analysis of telomere positions. (a) Anther culture methodology. One anther half was fixed immediately; synchronous anther halves were placed into culture and allowed to progress and then fixed at regular intervals (1 or 2 h). (b) Determining telomere distribution in rye meiotic nuclei. A representative early meiotic nucleus is shown (left). Telomeres (green) were detected by FISH and chromatin (red) was stained with DAPI. A three-dimensional model (right) of the nucleus was created, consisting of xyz coordinates, allowing for telomere distance and angle measurements. (c) Diagram of the measurements used to assess telomere distributions. The telomere distance (left) is the mean of all pairwise telomere–telomere distances in a nucleus. The telomere angle (right) is the mean of the angles created between each individual telomere and the mean telomere position through the center of the nucleus. Telomeres are shown as black circles, the mean telomere position is indicated with a white circle, and the center of the nucleus is marked with an “×.” For clarity, a subset of the 28 rye telomeres is diagrammed. Telomere–telomere distances are indicated by Δ (right); telomere-mean telomere angles are indicated by θ (left).

