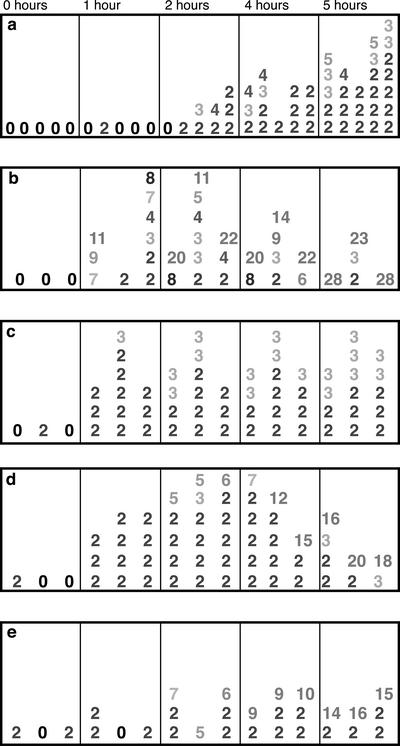
Figure 5.
Detection of mini-clusters at 1-h intervals in culture and in simulated nuclei. (a) Frequency and size of observed telomere mini-clusters. Each column represents a single nucleus at the time point indicated. Each number represents a single mini-cluster, and the number indicates how many telomeres were found in the minicluster. Data from five nuclei are shown for each time point. (b–e) Data from simulated nuclei at the same time points are shown for four conditions: (b) D = 4.1 × 10⁻² μm2/s, b = 0; (c) D = 2.4 × 10⁻² μm2/s, b = 0; (d) D = 2.4 × 10⁻⁴ μm2/s, b = 0.58; (e) D = 2.4 × 10⁻⁷ μm2/s, b = 10. Three nuclei were measured in each condition; data from each nucleus is listed in the same column position across the time points.

