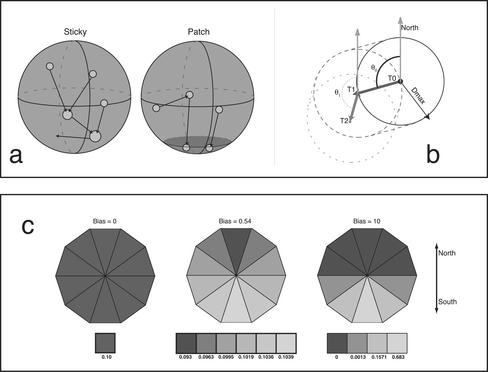
Figure 6.
Explanation of the simulation. (a) Cartoon of the two models, Sticky (left) and Patch (right). In the Sticky model, telomeres (circles) collide and coalesce until the bouquet is complete (all telomeres have coalesced into one cluster). In the patch model, telomeres move along the surface until they encounter the bouquet site (shading), at which point they cease motion. (b) Schematic of two steps of a telomere in the simulation. The telomere at T0 takes one step anywhere within the circle defined by the maximum distance (Dmax). The direction of motion is chosen by the angle θ. The probability of choosing a given θ is governed by the bias value (see c below). At T1, the bounding circle has shifted, a new θ is chosen, and another step is taken. (c) Illustration of the effect of increasing bias on the direction of motion of telomeres in the simulation. For ease of illustration the space of possible angles is divided into 10 wedges, and the probability of choosing a step into a given wedge is indicated by shade; the actual probabilities in the simulation are continuous. Probabilities were calculated by simulating 106 total steps for each bias value. With zero bias (left), the probability of choosing any direction is the same. Increasing the bias to 0.54 (center) results in a very slight increase in the probability of motion toward the bouquet pole, but allows normal bouquet completion for D = 2.4 μm2/s. A bias value of 10.0 (right) moves telomeres almost directly toward the South pole and allows timely bouquet completion with much lower diffusion constants.

