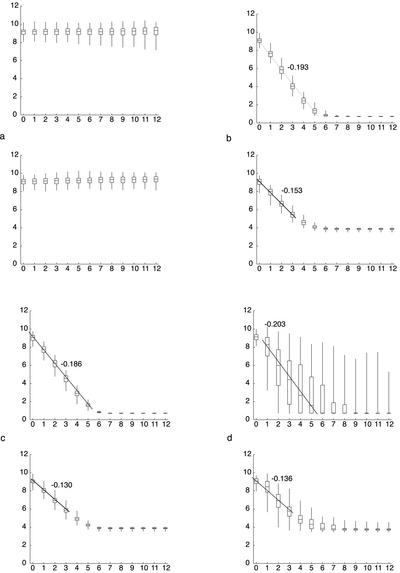
Figure 7.
Progression of simulated telomere clustering in the Sticky and Patch models for four conditions. Box-whisker diagrams display the distribution of pairwise distances for 100 simulated nuclei >12 h of simulation. In each pair of graphs, the results for the Sticky model are shown at top, and the Patch model at bottom. The following conditions are used: (a) Sticky, Patch: D = 2.4 × 10⁻⁴ μm2/s, b = 0; (b) Sticky: D = 2.4 × 10⁻⁴ μm2/s, b = 0.58; Patch: D = 2.4 × 10⁻⁴ μm2/s, b = 0.54 (c) Sticky: D = 2.4 × 10⁻⁷ μm2/s, b = 10; Patch: D = 1.5 × 10⁻⁷ μm2/s, b = 10 (d) Sticky: D = 4.1 × 10⁻² μm2/s, b = 0; Patch: D = 7.6 × 10⁻² μm2/s, b = 0.

