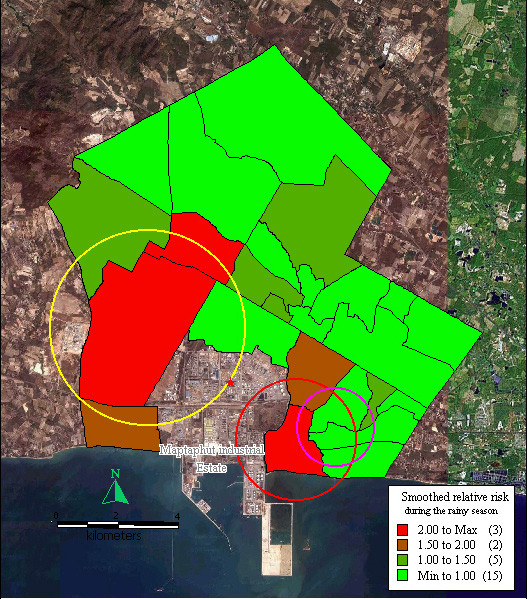
Figure 3.

Mapping of smoothed relative risk and disease clusters in the study area during the rainy season. Red circle indicates the first cluster of respiratory disease that includes Takuanaupradoo, Koakoknongtungmae and Nongnamyen. Yellow circle indicates the second cluster of respiratory disease that includes Mapchalood, Taladhauypong and Watsopol. Magenta circle indicates the third cluster of respiratory disease that includes Koakoknongtungmae, Nongnamyen and Takuanaupradoo. Red star sign indicates weighted mean centre of the stacks.
