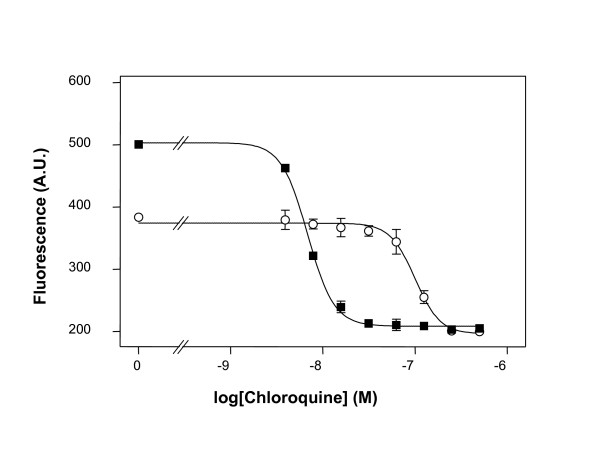
Figure 3.
Example of chloroquine responses of P. falciparum lines obtained with the improved PicoGreen® method. A typical sigmoidal graph showing the responses of P. falciparum lines 3D7 (■) and K1 (○) to different concentrations of chloroquine obtained with the improved PicoGreen® method. Each data point is the mean of two wells and the error bars show the standard error of the mean.

